Logs
Monitor runtime logs for your Globe deployments to debug errors, track application behavior, and validate configuration changes.
Logs show what's happening in your running application. Use them to debug errors, monitor behaviour, and validate configuration across environments.
Why Logs Matter
Logs help you:
- Debug runtime issues quickly
- Monitor application behavior in real-time
- Track backend activity and user interactions
- Validate configuration changes
Viewing Logs in the Dashboard
To view logs for any deployment:
- In the Globe dashboard, go to your project
- Open the Logs tab
- Filter by severity or time range
- Use the search bar to find specific messages
- Click into any deployment for more details
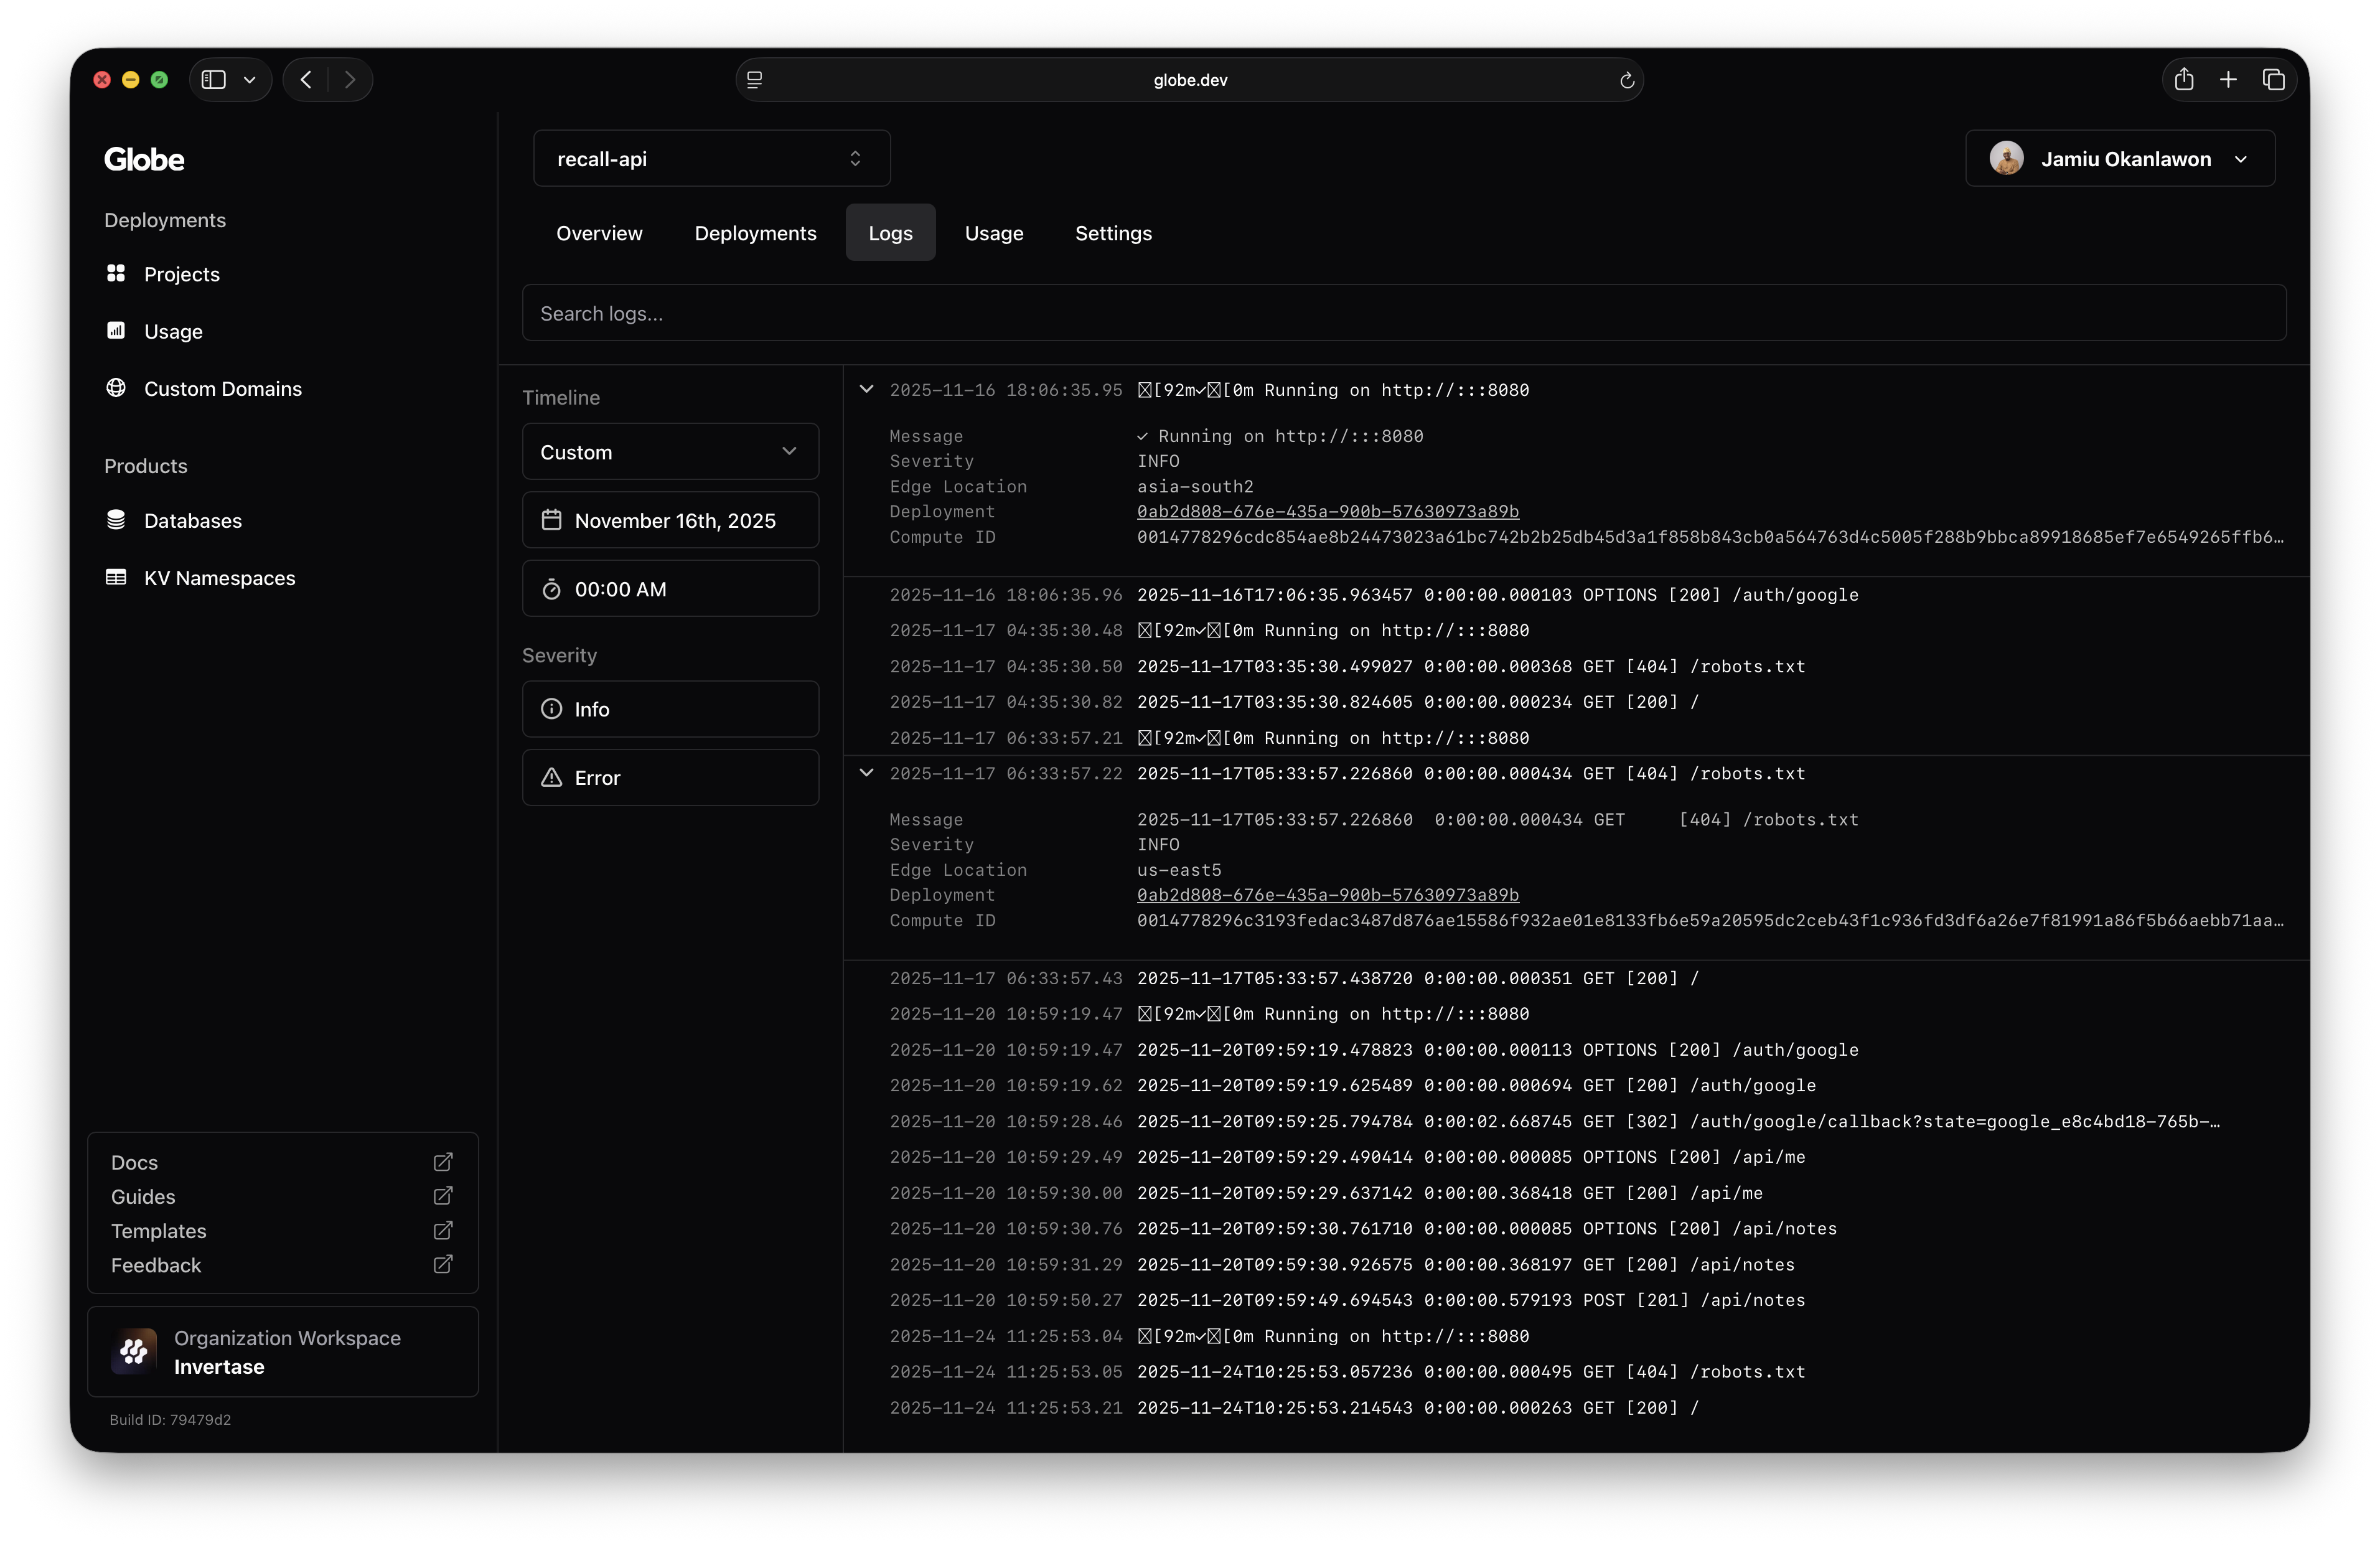
Each log entry shows:
- Timestamps: Every log entry is tagged with an accurate timestamp to trace events precisely
- Filtering: Filter logs by severity levels like INFO and ERROR for quicker debugging
- Search: Instantly search through logs to find relevant messages
- Time Range Selection: Focus on specific timeframes to narrow down issues
Log Severity Levels
Logs are grouped by severity to simplify triage:
| Level | Description |
|---|---|
| Info | Routine activity messages, i.e., requests received or background jobs completed. |
| Error | Issues that disrupt functionality, i.e. server errors or unhandled exceptions. |
Use logging levels in your app code to control what gets recorded and what's relevant in production vs local debugging.
Best Practices
To get the most out of your logs:
- Use structured logging in your code for better filtering and parsing
- Include context, like user IDs, request IDs, or environment tags to your messages
- Apply appropriate log levels to reduce noise
- Never log sensitive data such as passwords or personal information
- Write clear, descriptive messages that explain what happened and why
Related Topics
- Viewing Build Logs - View build logs using the CLI
- Deployments - Understand deployment status and lifecycle
- Usage - Track requests, resource usage, and performance metrics
- Troubleshooting - Common issues and solutions